Author: Dr. Dean M. Akiyama and Dany Yukasano
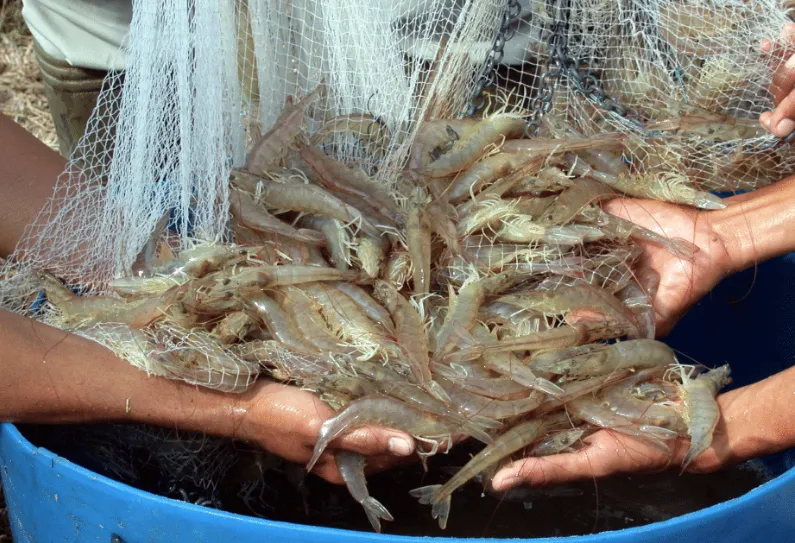
Shrimp of uniform size, clean, and of good quality at harvest, Indonesia
Feed is the highest variable cost in shrimp production, and feed management has a greater impact on the feed conversion ratio (FCR) at harvest than feed quality itself.
There is a general understanding that successful shrimp production requires emphasis on: dedicated farm management (accounting for 50-60%), quality and handling of postlarvae (20-25%), and consistent feed quality (20-25%). Additionally, the key to shrimp farming is the motivation and dedication of farm staff, where it is crucial that all personnel perform and complete tasks accurately and without delay when required.
Feed management accounts for 65-75% of the variability in the feed conversion ratio (FCR) at harvest. This is because the amount of feed per feeding, the number of feedings per day, the distribution of feed in the pond, and the adjustment of feed quantity have a greater impact on harvest FCR than feed quality alone.
A standard growth curve for each shrimp production site should be established, adjusted as needed, and maintained for proper pond and feed management. The daily growth rate of each pond should be monitored and compared to the standard curve. If the growth rate is within ±10% of the standard, pond conditions and feed management are acceptable. If the growth rate is below standard, farmers should check if water quality, pond bottom, and animal health are acceptable. If these factors are good, increase the feeding rate. If the growth curve is above standard, pond conditions are good but survival rate might be lower than expected. Consider reducing the feeding rate to maintain an acceptable FCR.

Figure 1. Each shrimp farm needs to establish a standard growth curve, calibrated as needed and regularly maintained to ensure effective pond and feed management. DOC = Days of Culture
Variable Costs in Production
Feed cost is the highest variable cost in shrimp production, accounting for 50-60% of total production costs. This percentage will vary by country or region due to differences in labor, electricity, postlarvae, and supply costs. However, proper shrimp feed management will ensure acceptable total feed costs with more stable production costs, increasing the feasibility of shrimp production.
Proper feed management will also improve water quality stability and reduce pond bottom degradation. There will be less wasted feed, which directly impacts water quality and pond bottom cleanliness.
Recommended Shrimp Feed Size
The current small diameter feed size is driven more by market demand than technical requirements. Shrimp do not swallow feed pellets whole; they cut and crush the pellets before consuming them. Therefore, pellet size is less critical. However, smaller pellets will have a higher number of pellets per kg, which is an advantage. Attractants, water-soluble vitamins, and minerals will leach faster from small-sized feed. Small feed particles are also more easily lost into pond sediments.
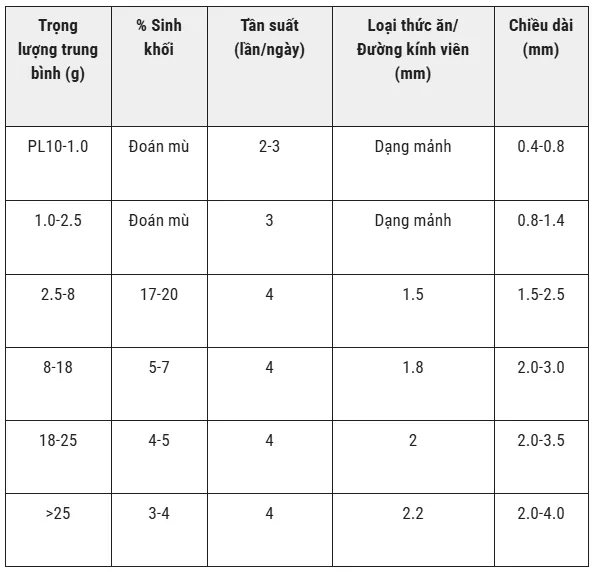
Table 1. Some general recommendations for feed pellet type and size in shrimp farming, corresponding to average body weight (ABW)
Feeding Time and Quantity
A minimum amount of feed should be allocated for any feeding time based on pond area, rather than strictly on biomass-based feeding rates for shrimp under 4g. A "blind feeding" program is recommended until shrimp reach an average of about 3.5g and when shrimp begin to appear on the feeding trays (nhá).
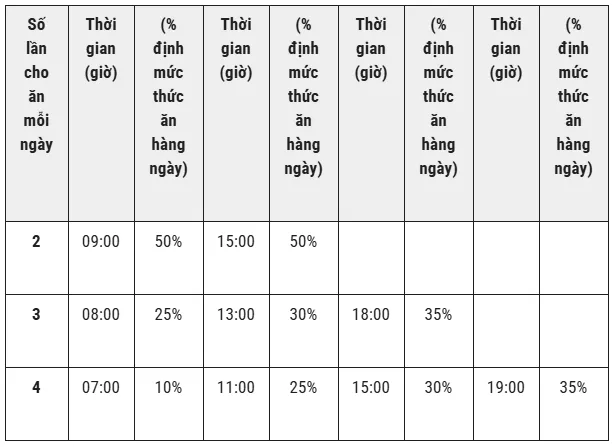
Table 2. Feed allocation by number of feedings per day
Monitoring Daily Feed Consumption
Many systems have been developed to monitor daily feed consumption. However, the most common and widely practiced system is the use of feeding trays (nhá). Proper use of nhá depends on dedicated and experienced farm technicians. These technicians must interpret data on consumption at the nhá, shrimp size, estimated biomass/survival rate, weather conditions, and water quality at the time of feeding.
Nhá are typically square or round with 10cm high sides. This is important because when the nhá is slowly lifted, shrimp remain inside, allowing observation of their health status and size uniformity. Nhá are weighted to sink evenly without feed washing out.
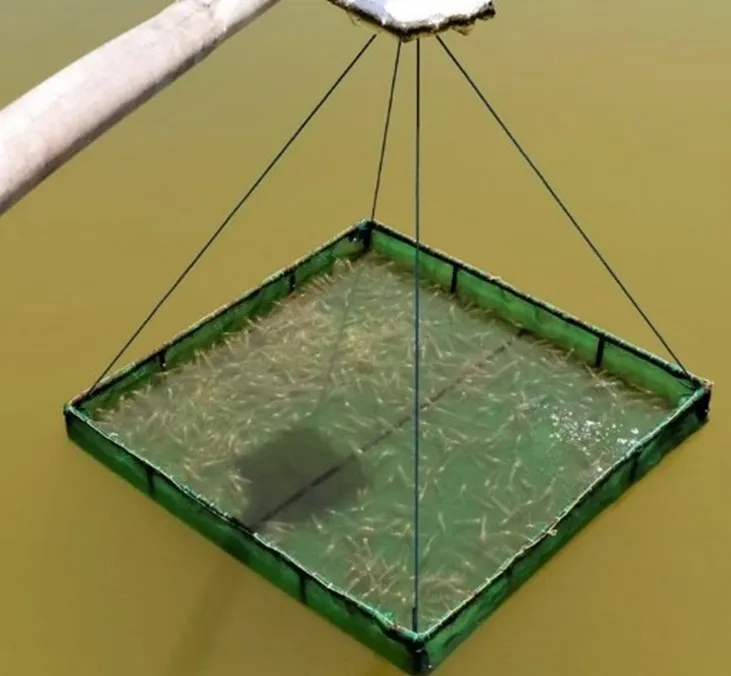
Slowly lifting the nhá helps observe shrimp health and size uniformity, Indonesia
Nhá are attached to the ends of piers in the pond. The pier length should be at least 2m from the bank. Nhá should be placed 30-50cm from the pond bottom. Sturdy piers need to be built for technicians to easily operate and observe the shrimp.
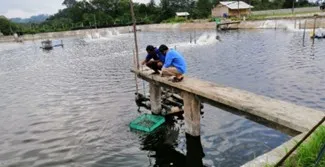
Solid concrete walkway for checking nhá, Indonesia
A minimum of 4 nhá should be used for a 0.5 ha pond (one nhá per side). Larger ponds require more nhá: 1 ha needs 6-8 nhá; 2-3 ha needs 8-10 nhá. To accurately calculate daily feed quantity, precise shrimp size (sampled by cast net) and accurate pond biomass (survival rate x stocking density x size, but this is difficult to estimate precisely) are needed.
Actual survival rates can range from 80% (due to poor transport and acclimation) to 120% (due to extra postlarvae provided as a bonus). Estimating survival rates from tables is unreliable. Biomass estimation should be based on the 3-day average of feed consumption to compensate for daily fluctuations. A skilled technician can estimate biomass within a 10% margin of error from the actual value. This is crucial for keeping FCR low, especially when survival rates are low.
Consumption Levels at Feeding Trays (nhá)
This is a tool to estimate biomass and survival rate in conjunction with sampling shrimp weight using a cast net. Biomass estimation is also important at harvest to determine the number of transport containers and the amount of ice needed.
Pond technicians will need: the 3-day average feed consumption, initial stocking density, average body weight (ABW) of shrimp, and a feeding table to perform the following calculations:
Biomass (kg) = 3-day average consumption (kg) / % Feeding rate according to shrimp size.