Authors: Jinzhu Yang a, Zhonghao Zhang a, Gang Lin b, Mingzhu Li c, Yanjiao Zhang a, Kangsen Mai a.
a The Key Laboratory of Aquaculture Nutrition and Feed (Ministry of Agriculture), The Key Laboratory of Mariculture (Ministry of Education), Ocean University of China, Qingdao, 266003, China
b Institute of Quality Standards and Testing Technology for Agricultural Products, Chinese Academy of Agricultural Sciences, Beijing, 100081, China
c College of Agriculture, Ludong University, Yantai, 264025, China
Highlights
- Organic copper can improve copper accumulation and transport in whiteleg shrimp.
- Organic copper can enhance low-temperature tolerance and physiological health of whiteleg shrimp.
- Organic copper provides better benefits at 20 mg/kg compared to inorganic copper at 30 mg/kg.
- High organic copper levels (40 mg/kg) have no toxic effects on whiteleg shrimp.
Abstract
This study was conducted to evaluate the effects of dietary copper source and level on hematological parameters, copper accumulation and transport, low-temperature resistance, antioxidant capacity, and immune response of whiteleg shrimp (Litopenaeus vannamei Boone, 1931). Seven experimental diets with different copper sources and levels were formulated: C, no copper supplementation; S, 30 mg/kg copper as CuSO₄·5H₂O; SO, 15 mg/kg copper from CuSO₄·5H₂O + 7.5 mg/kg copper from Cu-proteinate; O1, O2, O3 and O4, 10, 20, 30 and 40 mg/kg copper as Cu-proteinate, respectively. A total of 840 shrimp (5.30 ± 0.04 g) were randomly distributed into 21 tanks (3 tanks/diet, 40 shrimp/tank). An 8-week feeding trial was conducted. The results showed no significant differences in growth performance and whole-body chemical composition among all groups. Compared to inorganic copper, dietary organic copper (O2 and O3) increased plasma total protein, albumin, and glucose content, while decreasing plasma triglyceride and total cholesterol. Plasma and muscle copper concentrations, as well as gene expression of metallothionein and copper-transporting ATPase 2 (ATP7b like) in the hepatopancreas, were higher in shrimp fed organic copper (SO, O2, O3 and O4). The lowest mortality rate after a low-temperature challenge test (10°C) was observed in O2 and O3 groups. Organic copper (SO, O2, O3 and O4) significantly increased antioxidant capacity (indicated by higher activities of total superoxide dismutase, copper-zinc superoxide dismutase, catalase, glutathione peroxidase and total antioxidant capacity, lower plasma malondialdehyde concentration, and upregulated gene expression of superoxide dismutase, copper-zinc superoxide dismutase, catalase and glutathione peroxidase in the hepatopancreas). Organic copper (SO, O2, O3 and O4) enhanced immune response (indicated by a higher total hemocyte count, higher activities of acid phosphatase, alkaline phosphatase, phenoloxidase, hemocyanin and lysozyme in plasma, and higher gene expression of alkaline phosphatase, lysozyme and hemocyanin in the hepatopancreas). Inorganic copper (Diet S) also had positive effects on whiteleg shrimp compared to diet C, but diets SO, O2, O3 and O4 yielded better results, with diet O2 appearing to be the best. In conclusion, organic copper is more beneficial for shrimp health than copper sulfate.
1. Introduction
Copper is an essential trace element important for life. It acts as a cofactor or component of various enzymes involved in many vital physiological functions, such as cytochrome c oxidase (ATP production), ferroxidase (maintaining iron metabolism balance), tyrosine oxidase (catalyzing melanin synthesis from tyrosine), lysyl oxidase (collagen synthesis), and copper-zinc superoxide dismutase (Cu/Zn SOD) (antioxidant reactions) [[1], [2], [3]]. Copper is also an essential component of hemocyanin [[4]], which is responsible for oxygen transport in crustaceans [[5]]. Feed is the main source of copper for animals. Copper sulfate is a common inorganic mineral in feed [[6],[7]]. Plant materials are widely used to reduce fishmeal content in aquaculture [[8]]. However, plant-based ingredients contain phytic acid, which can affect the bioavailability of inorganic copper in the diet [[9]]. Although the effect of phytic acid on copper absorption is less significant than that of other elements like zinc and iron [[10]], studies have shown that phytic acid reduces copper retention in rats [[11], [12], [13]]. This leads to excessive supplementation of inorganic copper in feed, posing a potential risk of water pollution around aquaculture areas. Furthermore, excessive copper supplementation can be toxic to aquatic animals, causing oxidative stress, acid-base imbalance, and growth inhibition [[14]].
Organic minerals offer new alternatives to trace minerals with better bioavailability and immune-enhancing benefits for animals [[15], [16], [17]]. Organic copper, formed by chelating Cu²⁺ with amino acids, hydrolyzed proteins, and short peptides, can prevent copper-phytic acid, copper-vitamin, and copper-mineral interactions [[7],[18]]. Several studies have reported the benefits of organic copper for animals. In livestock and poultry, compared to inorganic copper, organic copper improves gut microbiota and reduces copper excretion in fattening pigs [[19]], and increases liver copper concentration and improves meat quality in ducks [[20]]. In aquaculture, organic copper supplementation increases growth rate, enhances tissue copper accumulation, antioxidant capacity, and immunity in Russian sturgeon (Acipenser gueldenstaedtii), showing higher bioavailability than inorganic copper [[21]]. Similarly, studies on Nile tilapia (Oreochromis niloticus) [[22]], Gibel carp (Carassius auratus gibelio) [[23]], and Japanese seabass (Lateolabrax japonicus) [[24]] also reported higher efficacy of organic copper compared to inorganic copper. Furthermore, in black rockfish (Sebastes schlegeli, Hilgendorf), compared to inorganic copper, organic copper improved disease resistance against Edwardsiella tarda [[25]]. Additionally, organic copper was 3-4 times more effective than inorganic copper in improving the growth of whiteleg shrimp (Litopenaeus vannamei Boone, 1931) by feeding semi-purified diets containing phytic acid [[26]]. Studies in commercial diets also demonstrated the positive effects of organic copper on growth performance and gut microbiota of whiteleg shrimp [[27]].
Whiteleg shrimp is an important aquaculture species globally, contributing 51.7% of crustacean production in 2020 [[28]], and has great economic value due to its good adaptability, fast growth rate, and high nutritional value [[29]]. However, biological factors (bacteria, parasites, and viruses) and abiotic factors (such as salinity, heavy metals, and low temperature) have been obstacles to the development of shrimp farming [[30],[31]]. Shrimp are unable to regulate their body temperature, and thus they are sensitive to temperature changes [[32]]. Low temperatures can cause various metabolic disorders and even mortality in shrimp [[33]]. Information on the effects of organic copper on low-temperature tolerance and immune response of whiteleg shrimp is limited. Therefore, this study aimed to investigate the effects of different dietary copper sources and levels on the growth, hematological parameters, copper homeostasis, low-temperature tolerance, antioxidant capacity, and immune response of whiteleg shrimp.
2. Materials and methods
2.1. Experimental diets and feeding trial
Seven isolipidic and isonitrogenous diets with different copper sources and levels were formulated: C, no copper supplementation; S, 30 mg/kg copper from CuSO₄·5H₂O; SO, 15 mg/kg copper from CuSO₄·5H₂O and 7.5 mg/kg copper from Cu-proteinate; O1, O2, O3 and O4, 10, 20, 30 and 40 mg/kg copper from Cu-proteinate, respectively. The formulation is presented in Table 1. Feed production was carried out according to the method of a previous study [[16]], in summary, all solid ingredients were ground and sieved through an 80-mesh (0.2 mm) screen. Then, the ingredients were thoroughly mixed and pelleted (pellet size < 2 mm). Subsequently, the feed was dried in an oven at 55°C to constant weight, and then stored at -20°C before use.
Table 1. Composition and formulation of experimental diets
(This table details the percentage of each ingredient in each diet (C, S, SO, O1, O2, O3, O4) and chemical, mineral composition analysis)
|
Ingredients (%) |
Diet |
||||||
|
C |
S |
SO |
O1 |
O2 |
O3 |
O4 |
|
|
Peanut meal: Peanut meal |
22 |
22 |
22 |
22 |
22 |
22 |
22 |
|
Flour: Flour |
22 |
22 |
22 |
22 |
22 |
22 |
22 |
|
Soybean meal: Soybean meal |
21 |
21 |
21 |
21 |
21 |
21 |
21 |
|
Cottonseed meal: Cottonseed meal |
8.5 |
8.5 |
8.5 |
8.5 |
8.5 |
8.5 |
8.5 |
|
Fish meal: Fish meal |
7 |
7 |
7 |
7 |
7 |
7 |
7 |
|
Blood cells meal: Blood cells meal |
4 |
4 |
4 |
4 |
4 |
4 |
4 |
|
Shrimp meal: Shrimp meal |
4 |
4 |
4 |
4 |
4 |
4 |
4 |
|
Chicken meal: Chicken meal |
2 |
2 |
2 |
2 |
2 |
2 |
2 |
|
Fish oil: Fish oil |
2 |
2 |
2 |
2 |
2 |
2 |
2 |
|
Phospholipid: Phospholipid |
1 |
1 |
1 |
1 |
1 |
1 |
1 |
|
Squid paste: Squid paste |
1 |
1 |
1 |
1 |
1 |
1 |
1 |
|
Monocalcium phosphate: Monocalcium phosphate |
1 |
1 |
1 |
1 |
1 |
1 |
1 |
|
Unite bran: Rice bran (Unite bran may be a brand name for a specific type of rice bran) |
3.59 |
3.578 |
3.5765 |
3.58 |
3.57 |
3.56 |
3.55 |
|
Vitamin mix: Vitamin Premix |
0.2 |
0.2 |
0.2 |
0.2 |
0.2 |
0.2 |
0.2 |
|
Mineral mix: Mineral Premix |
0.5 |
0.5 |
0.5 |
0.5 |
0.5 |
0.5 |
0.5 |
|
Choline chloride: Choline chloride |
0.2 |
0.2 |
0.2 |
0.2 |
0.2 |
0.2 |
0.2 |
|
Y₂O₃: Yttrium oxide (Y₂O₃) - commonly used as a marker |
0.01 |
0.01 |
0.01 |
0.01 |
0.01 |
0.01 |
0.01 |
|
CuSO₄·5H₂O: Copper sulfate pentahydrate |
– |
0.012 |
0.006 |
– |
– |
– |
– |
|
Bioplex Cu: Organic copper (Bioplex® Cu - a commercial organic copper chelate) |
– |
– |
0.0075 |
0.01 |
0.02 |
0.03 |
0.04 |
|
Chemical composition (% dry matter) |
|||||||
|
Crude protein: Crude protein |
43.51 |
43.51 |
43.69 |
43.96 |
44.52 |
43.87 |
43.88 |
|
Crude lipid: Crude lipid |
4.33 |
4.62 |
4.23 |
5.43 |
4.77 |
4.12 |
4.35 |
|
Ash: Ash |
9.16 |
9.08 |
9.05 |
9.05 |
9.15 |
9.17 |
9.1 |
|
Mineral analysis (mg/kg) |
|||||||
|
Cu (formulated value): Copper (formulated value) |
0 |
30 |
22.5 |
10 |
20 |
30 |
40 |
|
Cu (analyzed value): Copper (actual analyzed value) |
14.29 |
43.99 |
38.08 |
29.01 |
39.54 |
54.03 |
66.61 |
2.2. Feeding trial
Whiteleg shrimp were purchased from Rizhao Tengyun Aquaculture Co., Ltd. The feeding trial was conducted locally. Shrimp were fed diet S for 7 days to acclimate to the rearing environment. Then, shrimp of similar size (5.30 ± 0.04 g) were selected and distributed into 21 tanks (200 L). Each tank contained 40 shrimp, and each group had 3 replicate tanks. The feeding trial was conducted according to previous research with some modifications [[16]]. In summary, shrimp were fed 4 times daily (05:30, 11:00, 17:00, and 23:00). The daily feeding amount was 4% of body weight and adjusted according to consumption. Seawater was changed by half once a day. In addition, during the feeding trial, water quality was checked twice a week, and the parameters were as follows: temperature 24.6 ± 0.6°C; dissolved oxygen >7 mg/L; salinity 18‰; pH 8.3 ± 0.1; nitrate <10 mg/L; nitrite 0.03 ± 0.02 mg/L; ammonia <0.02 mg/L, copper <0.01 mg/L.
2.3. Sample collection
Sample collection was performed according to previous research with some modifications [[16]]. In summary, shrimp were fasted for 24 hours after 8 weeks of feeding, then the length and weight of each shrimp were measured. Subsequently, 12 shrimp were selected from each tank. Approximately 0.5 mL of hemolymph (blood fluid) was collected from each shrimp and immediately mixed with anticoagulant (450 mmol/L NaCl, 10 mmol/L HEPES, 10 mmol/L EDTA-Na₂, 10 mmol/L KCl, pH 7.3, ratio 1 hemolymph : 1.5 anticoagulant) [[34]]. Then, 30 μL of hemolymph was taken for total hemocyte count. The remainder was centrifuged at 4°C for 10 minutes at 500 g/min. Plasma was collected and stored at -80°C. The hepatopancreas of 6 shrimp from each tank was removed and frozen in liquid nitrogen, then transferred to RNase-free sterile tubes and stored at -80°C. Muscle from 2 shrimp from each tank was collected and stored at -20°C.
2.4. Calculation of growth performance and hemocyte count
The following equations were used:
(1) Weight Gain Rate (WGR, %) = (Final weight - Initial weight) / Initial weight × 100
(2) Specific Growth Rate (SGR, %/day) = (Ln(Final weight) - Ln(Initial weight)) / number of days × 100
(3) Feed Intake (FI, %/day) = Feed intake / ((Initial weight + Final weight)/2 × number of days) × 100
(4) Feed Efficiency (FE) = (Final weight - Initial weight) / Feed intake
(5) Condition Factor (CF, 100 g/cm³) = (Body weight / Body length³) × 100
Total hemocytes were counted under a microscope (N-300 M, Ningbo Yongxin Optics Co., Ltd., Ningbo, China). The hemocyte count was calculated using the following equation:
(6) Hemocyte count (cells/mL) = (A × dilution factor B × 10⁴) / 5
A is the total number of hemocytes counted in 5 average squares. B is the dilution ratio.
2.5. Chemical analysis of feed and whole shrimp
The chemical composition of feed and shrimp was analyzed according to the AOAC protocol [[35]]. Dry matter was measured by drying samples to constant weight at 105°C, the Kjeldahl method was used to determine crude protein content, the Soxhlet method was used to determine crude lipid; the ignition method was used to determine ash content using a muffle furnace at 550°C.
Moisture and ash content were measured using the following equations:
(7) Moisture content (%) = (Wet weight - Dry weight) / Wet weight × 100
(8) Ash content (%) = (Ash weight after ignition / Dry weight) × 100
2.6. Low-temperature stress
For low-temperature stress, shrimp were fasted for 24 hours after 8 weeks of feeding, 10 shrimp of similar size and good vitality were randomly selected from each tank. The challenge test was conducted in 21 styrofoam boxes. In each box, approximately 10 L of seawater was added. Ice packs were used to lower the water temperature until it reached 10°C. Ice packs were changed every 12 hours to maintain water temperature. Mortality was recorded for 36 hours. During the challenge test, shrimp were not fed.
2.7. Plasma components and enzyme activities
Commercial assay kits were used to determine the concentrations of glucose (Glu, S0201S), malondialdehyde (MDA, S0131 M), and total protein (TP, P0006) and the activities of acid phosphatase (ACP, P0326), alkaline phosphatase (AKP, P0321S), catalase (CAT, S0051), Cu/Zn SOD (S0103) and total superoxide dismutase (T-SOD S0101 M) in plasma (Beyotime Biotechnology). ELISA assay kits were used to determine the activities of hemocyanin (Hemo, F952236-A) and lysozyme (LZM, F5103) (Shanghai FANKEL Industrial Co., Ltd. Shanghai, China). Commercial assay kits were used to determine the concentrations of albumin (ALB, A028-1-1), copper (Cu, E010-1-1), total cholesterol (T-CHO, A111-2-1) and triglyceride (TG, A110-2-1), and the activities of glutathione peroxidase (Gpx, A005-1), phenoloxidase (PO, H247), and total antioxidant capacity (T-AOC, A015-2-1) in plasma (Nanjing Jiancheng Bioengineering Institute).
2.8. RNA extraction and qPCR
The MolPure® Cell/Tissue Total RNA Kit was used to extract total RNA from the hepatopancreas (19221ES50; Yeasen Biotechnology (Shanghai) Co., Ltd., Shanghai, China). 1.2% (w/v) agarose gel was used to determine the integrity of the extracted RNA. A NanoDrop™ 2000 spectrophotometer (Thermo Scientific™, Waltham, MA, USA) was used to assess the concentration and quality of RNA. Hifair® III 1st Strand cDNA Synthesis SuperMix for qPCR was used for reverse transcription of RNA (11141ES60; Yeasen, Shanghai, China).
The qPCR reaction was performed in a total volume of 20 μL: cDNA template, 1 μL; forward primer 10 μM, 0.4 μL; reverse primer 10 μM, 0.4 μL; RNase-free ddH₂O, 8.2 μL; SYBR® Green Premix Pro Taq HS qPCR Kit (AG11701, Accurate Biotechnology (Hunan) Co., Ltd., Hunan, China), 10 μL. Furthermore, a no-template control (NTC) was set up to detect exogenous nucleic acid contamination. The qPCR program was as follows: 95°C for 30 seconds, 40 cycles of 5 seconds at 95°C and 30 seconds at 60°C. qPCR analysis was performed on a real-time PCR machine (CFX96, Bio-Rad, Hercules, CA, USA). Primers were designed using the Primer-BLAST tool of the National Center for Biotechnology Information and synthesized by Sangon Biotech (Shanghai) Co., Ltd (Table 2). β-Actin was selected as the reference gene based on previous research [[16]]. Relative gene expression levels were calculated using the 2^−ΔΔCq^ method [[36]].
Table 2. Primer sequences and qPCR amplification information
(This table lists primer sequences, annealing temperature, product length, amplification efficiency, and GenBank accession numbers for each gene: ACP, AKP, ATP7b like, CAT, Cu/Zn SOD, Gpx, Hemo, LZM, MT, ProPO, SOD, β-actin
|
Genes |
Primer Sequence (5′-3′) |
Tm (°C) |
Length |
Amplification |
GenBank |
|
ACP |
F: AAGCCTGAAGTTCGTGCTGA |
60 |
97 |
1.034 |
|
|
R: TGACTCTGGTGCAGTCATCG |
|||||
|
AKP |
F: GCGAGACGACAACGGATTC |
60 |
170 |
1.114 |
|
|
R: CAGCGGTGACGATGATAAGAG |
|||||
|
ATP7b like |
F: TGACCCATCAGTCTTGAGTGC |
60 |
135 |
0.941 |
|
|
R: TCATGGCTGGCCTTAGGAAC |
|||||
|
CAT |
F: TAAGGGAGCAGGTGCCTTTG |
60 |
157 |
1.002 |
|
|
R: ATCCCTGGCAGTGTCAGTTG |
|||||
|
Cu/Zn SOD |
F: ACAATCCGTATATGCGCCCC |
60 |
145 |
1.016 |
|
|
R: ACCGTACGAGGTCCCACTAA |
|||||
|
Gpx |
F: GGCACCAGGAGAACACTACC |
60 |
73 |
1.026 |
|
|
R: TCGAAGTTGTTCCCAGGACG |
|||||
|
Hemo |
F: AGACTGGGCATCCTTTGTCG |
60 |
135 |
1.063 |
|
|
R: TCATAGAGGGGAGGGAGCAC |
|||||
|
LZM |
F: GGTGCGCCGAGACTATCC |
60 |
85 |
1.069 |
|
|
R: TTGCTGTTGTAAGCCACCCA |
|||||
|
MT |
F: CCCATCCAAGGAGGAGTGTG |
60 |
88 |
1.034 |
|
|
R: AGCAGCAGAAGACAGTCGAG |
|||||
|
ProPO |
F: GAACTCCATTCCGTCCGTCTG |
60 |
123 |
1.048 |
|
|
R: GGCTTCGCTCTGGTTAGGAT |
|||||
|
SOD |
F: ACGTAAGCGCAATGAATGCC |
60 |
93 |
1.087 |
|
|
R: GAAGCCATGTTGGGTCCAGA |
|||||
|
β-actin |
F: CGAGAGGAAGCAGCACGTA |
60 |
164 |
1.01 |
|
|
R: GACGATGGAGGGGAACACAG |
Abbreviations:
ACP: Acid phosphatase, AKP: Alkaline phosphatase, ATP7b like: Copper-transporting ATPase 2 (ATP7b like), CAT: Catalase, Cu/Zn SOD: Copper/zinc superoxide dismutase, Gpx: Glutathione peroxidase, Hemo: Hemocyanin, LZM: Lysozyme, MT: Metallothionein, ProPO: Pro-phenoloxidase, SOD: Superoxide dismutase
2.9. Analysis of copper accumulation
Copper concentrations in feed and muscle were analyzed by inductively coupled plasma optical emission spectrometry (ICP-OES). Briefly, approximately 0.2 g of dry feed and dry muscle were weighed and transferred to microwave digestion tubes. Ten mL of HNO₃ (AR, 65–70%) was added to each tube. After digestion, the samples were completely dissolved in ultrapure water and diluted to 25 mL. All samples were analyzed for copper using an ICP-OES instrument (Avio 200, PerkinElmer, MA, USA).
2.10. Statistical analysis
Results were analyzed by one-way analysis of variance (ANOVA). Tukey's multiple comparison range test was used to compare multiple group means. Differences were considered significant when P < 0.05. Data were analyzed using SPSS 22.0 (IBM SPSS Corporation, Chicago, IL, USA).
3. Results
3.1. Growth performance and chemical composition
No significant differences were found in FBW (final body weight), WGR, SGR, FI, FE or CF, crude protein, moisture or crude lipid of shrimp among all groups (Table 3) (P > 0.05).
Table 3. Effects of organic and inorganic copper on growth performance and chemical composition of whiteleg shrimp
(This table presents data on initial/final weight, WGR, SGR, FI, FE, CF, moisture, crude protein, crude lipid for groups C, S, SO, O1, O2, O3, O4. No statistically significant differences were found)
|
Diet |
C |
S |
SO |
O1 |
O2 |
O3 |
O4 |
|
IBW (g) |
5.27 ± 0.01 |
5.33 ± 0.02 |
5.32 ± 0.02 |
5.30 ± 0.04 |
5.30 ± 0.01 |
5.27 ± 0.02 |
5.29 ± 0.01 |
|
FBW (g) |
10.41 ± 0.21 |
10.75 ± 0.35 |
9.73 ± 0.52 |
10.56 ± 0.25 |
9.74 ± 0.22 |
9.99 ± 0.61 |
9.82 ± 0.71 |
|
WGR (%) |
97.5 ± 4.2 |
101.9 ± 7.3 |
82.9 ± 9.2 |
99.3 ± 4.1 |
83.9 ± 4.0 |
89.8 ± 11.6 |
85.6 ± 13.3 |
|
SGR (%/day) |
1.21 ± 0.04 |
1.25 ± 0.07 |
1.07 ± 0.09 |
1.23 ± 0.04 |
1.09 ± 0.04 |
1.14 ± 0.11 |
1.10 ± 0.12 |
|
FI (%/day) |
2.64 ± 0.19 |
2.66 ± 0.22 |
2.62 ± 0.19 |
2.66 ± 0.11 |
2.85 ± 0.15 |
2.50 ± 0.15 |
2.75 ± 0.12 |
|
FE |
0.503 ± 0.023 |
0.517 ± 0.058 |
0.460 ± 0.071 |
0.514 ± 0.034 |
0.429 ± 0.034 |
0.502 ± 0.072 |
0.432 ± 0.066 |
|
CF (100 g/cm3) |
0.874 ± 0.031 |
0.850 ± 0.009 |
0.843 ± 0.005 |
0.856 ± 0.008 |
0.875 ± 0.017 |
0.878 ± 0.009 |
0.880 ± 0.008 |
|
Chemical composition (wet weight) |
|||||||
|
Moisture (%) |
78.59 ± 0.41 |
79.31 ± 0.94 |
77.82 ± 1.24 |
77.70 ± 0.71 |
78.99 ± 0.55 |
78.03 ± 0.57 |
78.45 ± 0.55 |
|
Crude protein (%) |
15.66 ± 0.06 |
15.79 ± 0.14 |
16.35 ± 0.24 |
16.33 ± 0.29 |
16.03 ± 0.40 |
16.39 ± 0.09 |
15.80 ± 0.06 |
|
Crude fat (%) |
1.02 ± 0.05 |
1.21 ± 0.12 |
1.10 ± 0.02 |
1.11 ± 0.06 |
1.00 ± 0.04 |
1.01 ± 0.04 |
1.08 ± 0.03 |
3.2. Hematological parameters
In plasma, as shown in Table 4, groups S, O2, and O4 had significantly higher TP concentrations than groups C, SO, and O1 (P < 0.05). Group O3 had the highest TP concentration (P < 0.05). Groups O2, O3, and O4 had significantly higher ALB concentrations than groups C, S, SO, and O1 (P < 0.05). Glu concentrations in groups S, O2, and O3 were significantly higher than in groups C and O1 (P < 0.05). Glu concentration in group O3 was significantly higher than in groups SO and O4 (P < 0.05). Groups S, O1, and O2 had significantly higher TG concentrations than groups SO, O3, and O4 and significantly lower than group C (P < 0.05). Groups O1 and O2 had significantly higher T-CHO concentrations than groups SO, O3, and O4 and significantly lower than group C (P < 0.05).
Table 4. Effects of organic and inorganic copper on biochemical parameters in shrimp plasma
(This table presents data on TP, ALB, Glu, TG, T-CHO in plasma for groups C, S, SO, O1, O2, O3, O4. Different superscript letters indicate statistically significant differences).
|
Diet |
C |
S |
SO |
O1 |
O2 |
O3 |
O4 |
|
TP (g/L) |
89.91 ± 2.64a |
140.88 ± 1.92c |
109.85 ± 4.15b |
106.09 ± 4.77ab |
143.99 ± 6.26c |
167.17 ± 0.52d |
135.14 ± 4.47c |
|
ALB (g/L) |
19.02 ± 0.53a |
18.22 ± 0.78a |
20.19 ± 1.12a |
20.81 ± 0.81a |
31.68 ± 1.71b |
32.66 ± 1.76b |
30.47 ± 2.22b |
|
Glu (mmol/L) |
0.561 ± 0.011a |
0.726 ± 0.024bc |
0.650 ± 0.020ab |
0.606 ± 0.035a |
0.736 ± 0.034bc |
0.839 ± 0.010c |
0.665 ± 0.034ab |
|
TG (mmol/L) |
0.886 ± 0.038c |
0.611 ± 0.057b |
0.379 ± 0.010a |
0.620 ± 0.025b |
0.583 ± 0.027b |
0.315 ± 0.009a |
0.403 ± 0.055a |
|
T-CHO (mmol/L) |
1.183 ± 0.030d |
0.608 ± 0.035a |
0.791 ± 0.020bc |
0.945 ± 0.043c |
0.860 ± 0.046c |
0.547 ± 0.014a |
0.673 ± 0.064ab |
3.3. Copper accumulation and transport
In Figure 1A, groups O2, O3, and O4 had significantly higher muscle copper concentrations than groups C and O1 (P < 0.05). Group C had the lowest plasma copper concentration (P < 0.05). Group O2 had significantly higher plasma copper concentration than group S (P < 0.05). Groups O2 and O3 had significantly higher plasma copper concentrations than groups SO, O1, and O4 (P < 0.05).
In the hepatopancreas (Figure 1B), MT expression in shrimp fed diets SO, O1, O2, O3, and O4 was significantly upregulated compared to diet C (P < 0.05). MT expression in group O3 was significantly higher than in group S (P < 0.05). ATP7b like expression in groups SO, O2, O3, and O4 was significantly higher than in groups C, S, and O1 (P < 0.05). ATP7b like expression in group O1 was significantly higher than in group C (P < 0.05).
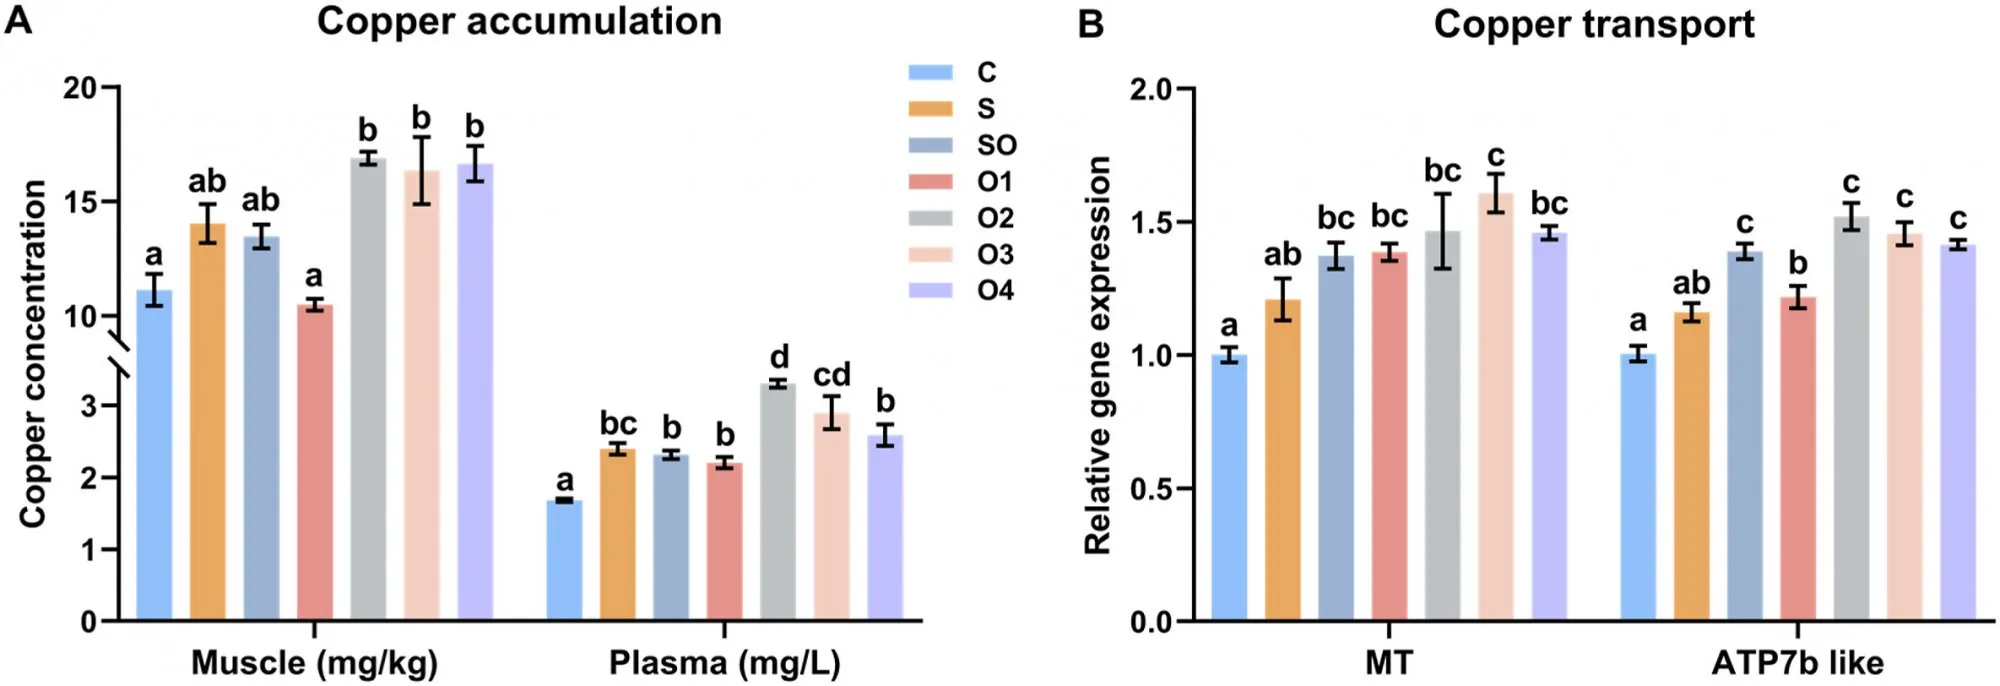
Figure 1. Effects of organic and inorganic copper on copper accumulation in muscle and plasma (A) and expression of copper transport-related genes in the hepatopancreas of whiteleg shrimp (B). Results are presented as mean ± S.E. of 3 replicate tanks. Different superscript letters indicate significant differences (P < 0.05).
3.4. Low temperature stress
Shrimp fed copper-supplemented diets showed lower mortality rates after 36 hours of low-temperature stress. The mortality rates of shrimp fed diets S, SO, O1, O2, O3, and O4 were 28.57%, 38.10%, 33.33%, 52.38%, 47.62%, and 28.57% lower, respectively, compared to diet C. Groups O2 and O3 had significantly lower mortality rates than group C (Figure 2) (P < 0.05).
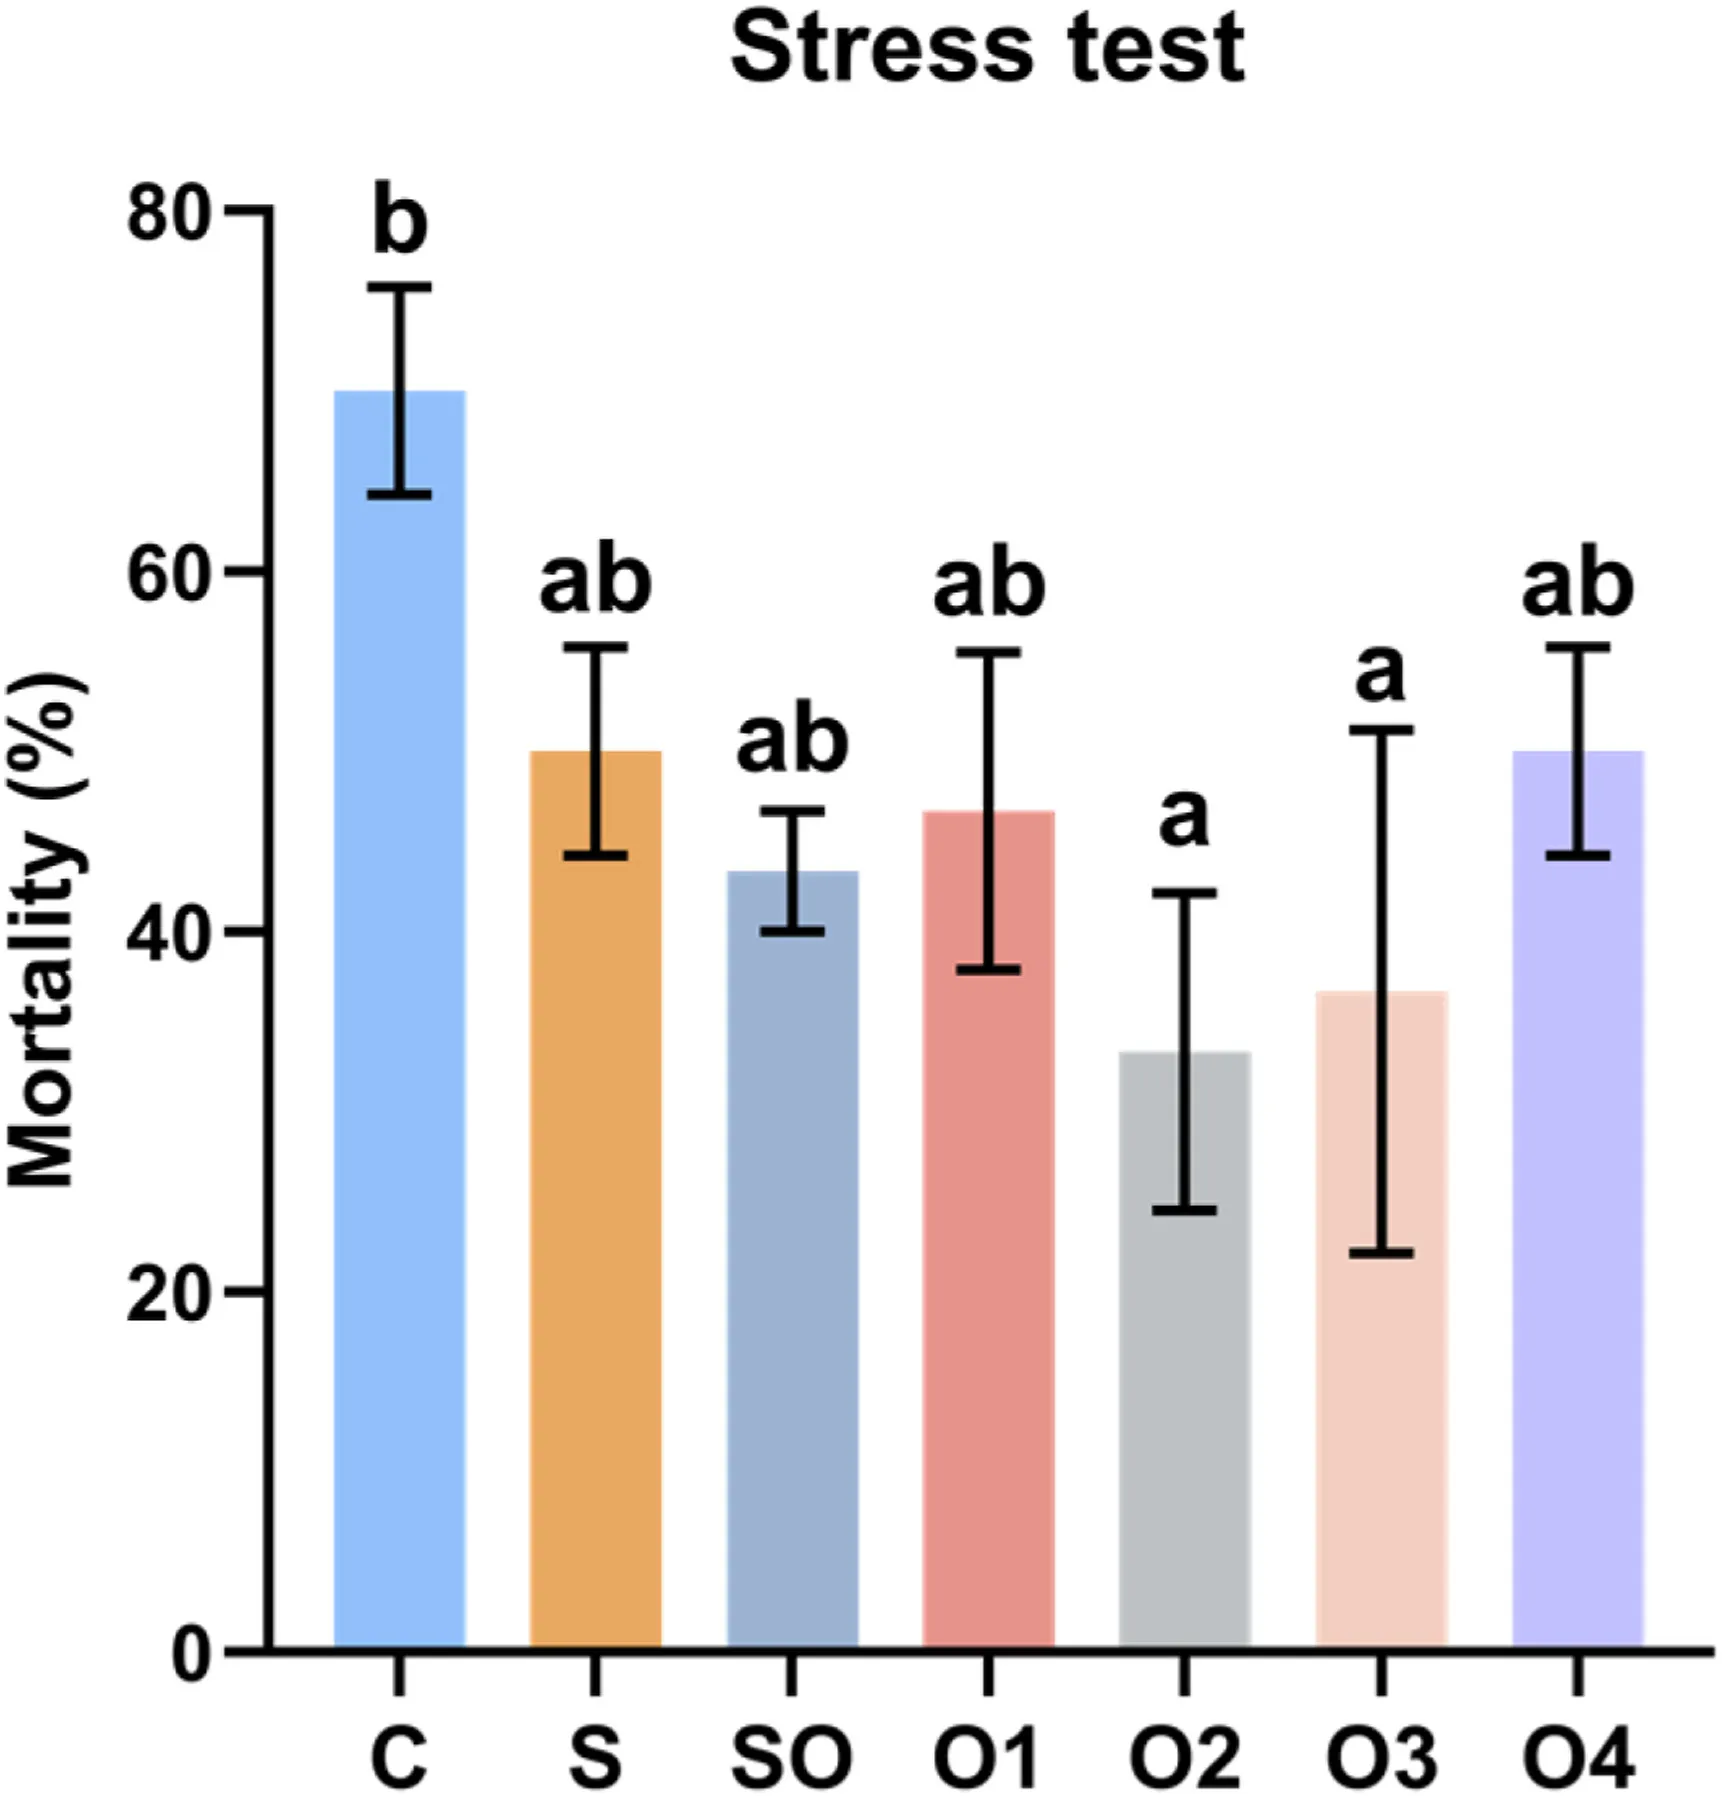
Figure 2. Effects of organic and inorganic copper on the mortality rate of whiteleg shrimp after 36 hours of low-temperature stress. Results are presented as mean ± S.E. of 3 replicate tanks. Different superscript letters indicate significant differences (P < 0.05).
3.5. Antioxidant capacity
In plasma (Figure 3A), groups SO, O2, O3, and O4 had significantly higher T-SOD activity than groups C and S (P < 0.05). Groups SO, O2, O3, and O4 had significantly higher Cu/Zn SOD activity than groups C, S, and O1 (P < 0.05). Groups SO, O2, O3, and O4 had significantly higher CAT activity than groups C, S, and O1 (P < 0.05). Groups SO, O2, O3, and O4 had significantly higher Gpx activity than groups C, S, and O1 (P < 0.05). Groups SO, O2, O3, and O4 had significantly higher T-AOC activity than groups C, S, and O1 (P < 0.05). Groups S, SO, O2, O3, and O4 had significantly lower MDA concentrations than group C (P < 0.05). The MDA concentration of group O1 was significantly lower than that of group C (P < 0.05).
In the hepatopancreas (Figure 3C), SOD expression in groups SO, O2, O3, and O4 was significantly higher than in groups C, S, and O1 (P < 0.05). Cu/Zn SOD expression in groups SO, O2, O3, and O4 was significantly higher than in groups C, S, and O1 (P < 0.05). CAT expression in groups SO, O2, O3, and O4 was significantly higher than in groups C, S, and O1 (P < 0.05). Gpx expression in groups SO, O2, O3, and O4 was significantly higher than in groups C, S, and O1 (P < 0.05).
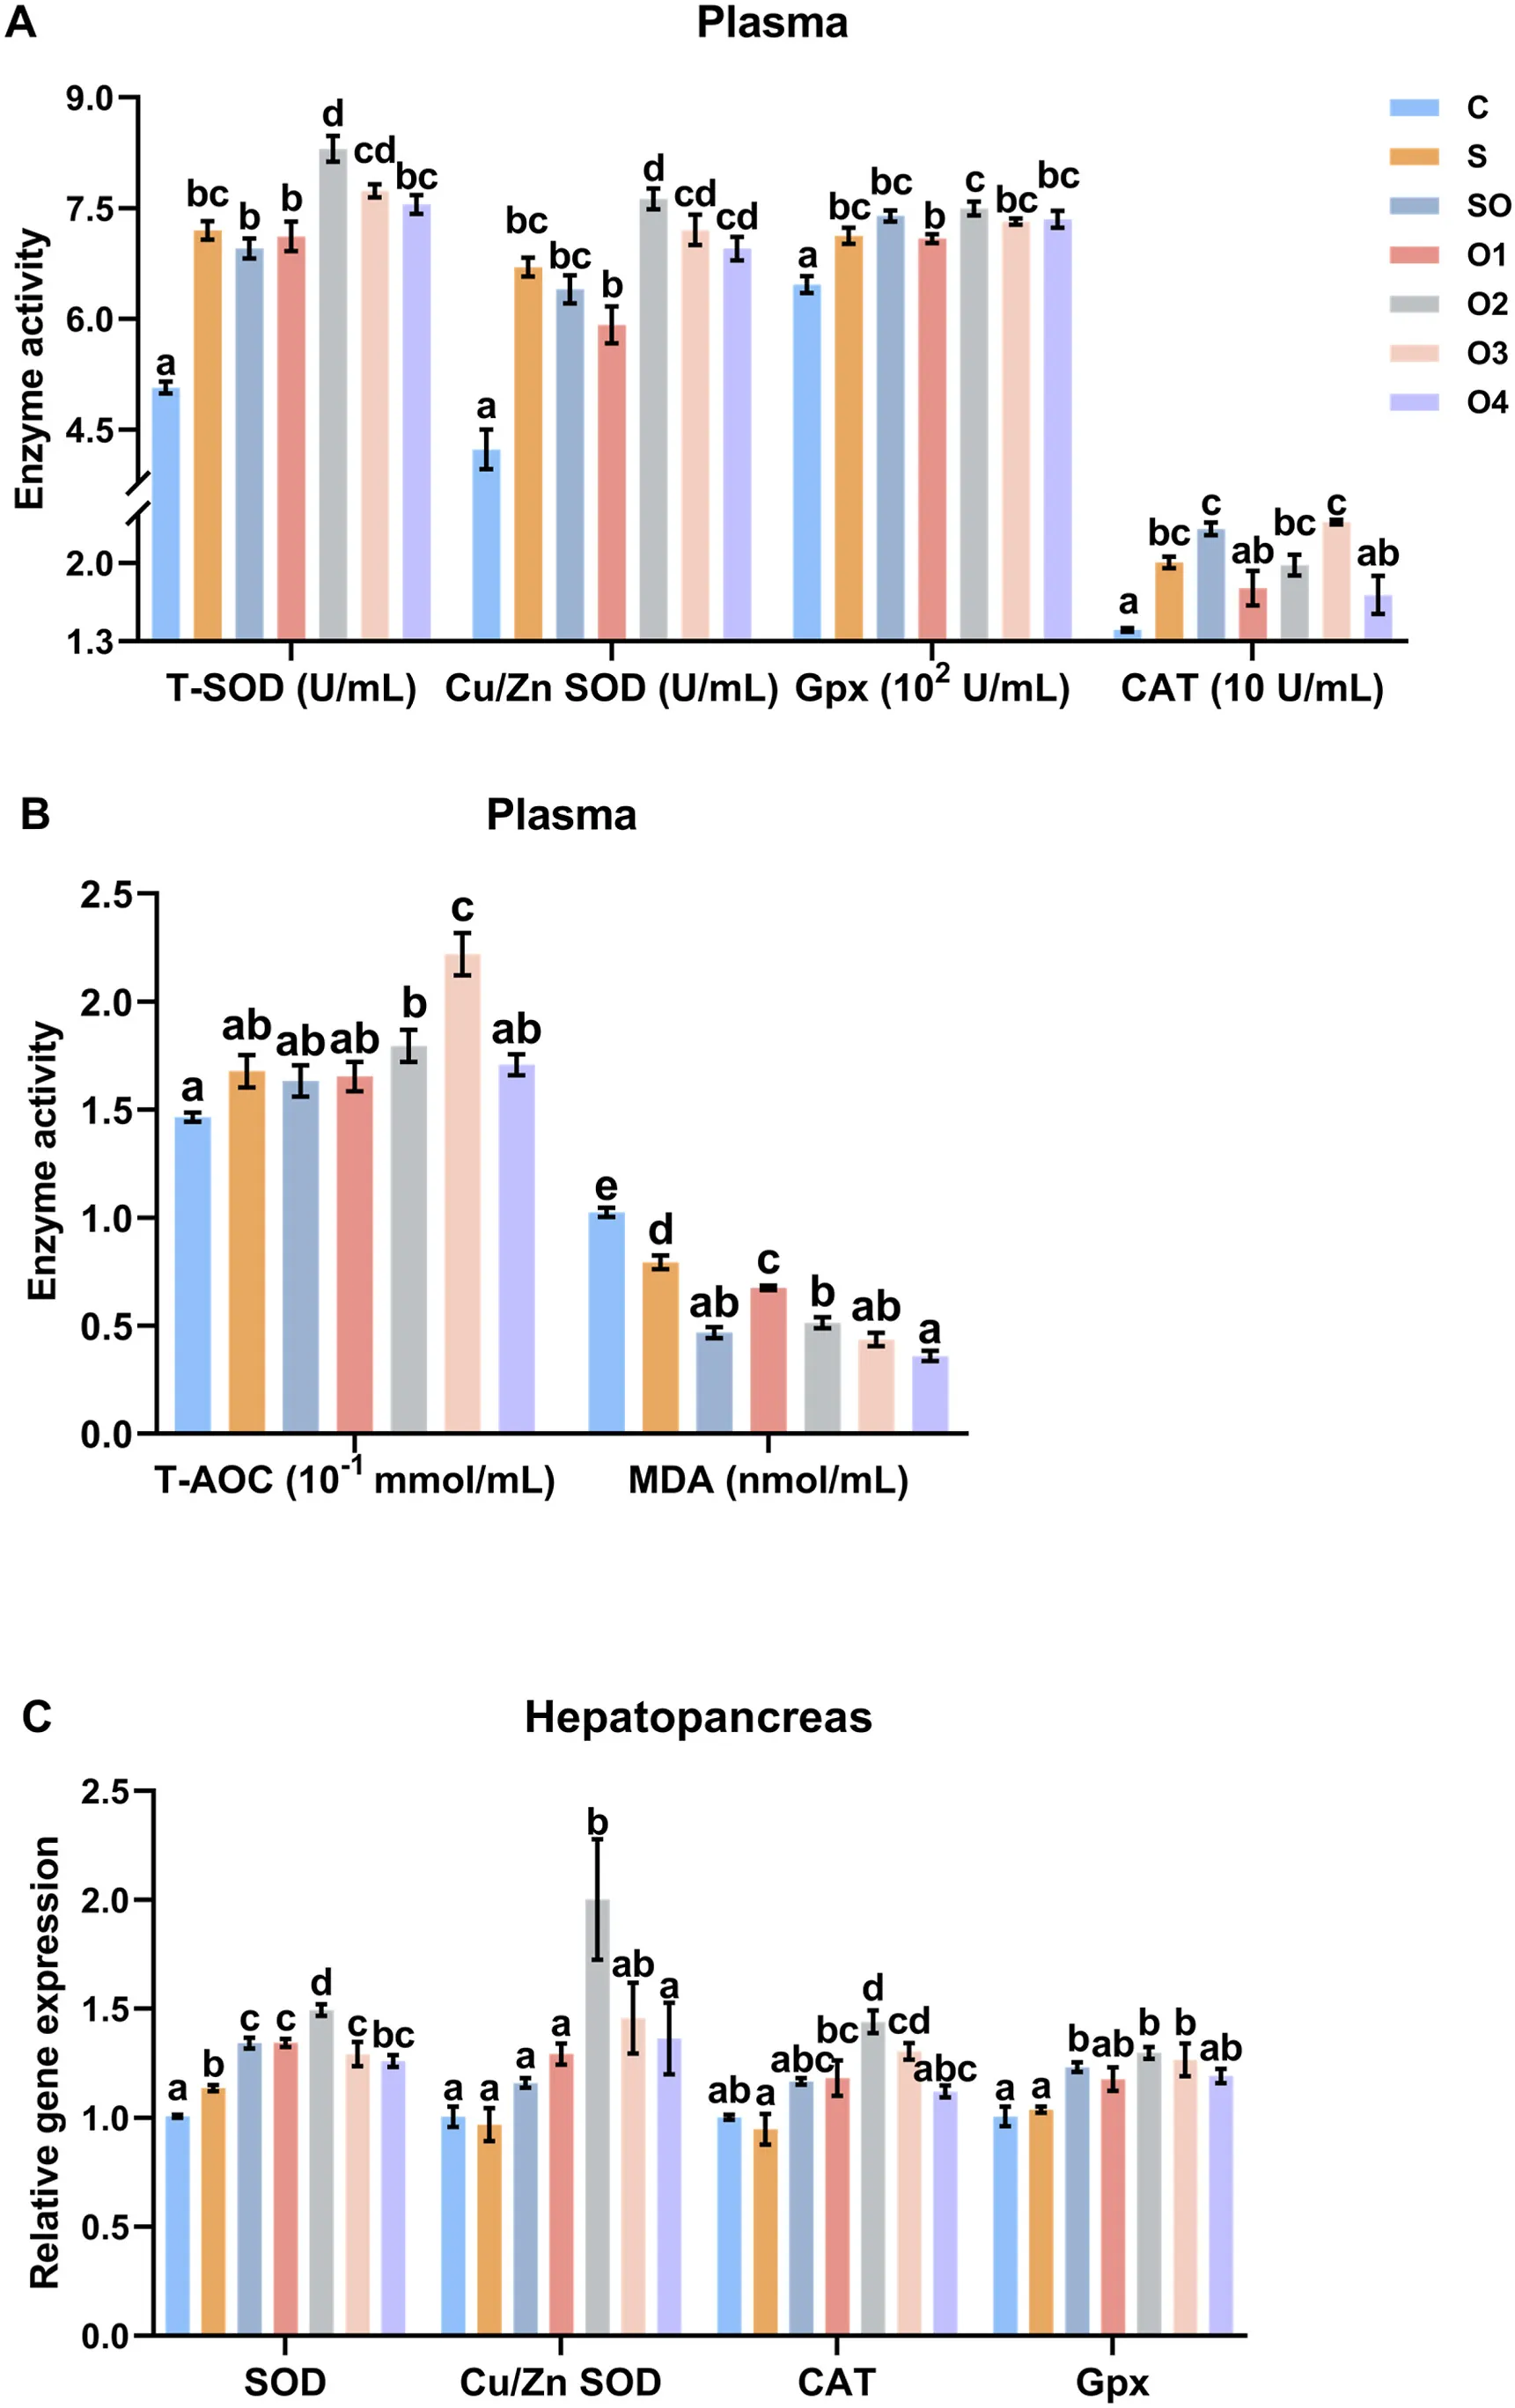
Figure 3. Effects of organic and inorganic copper on the expression of antioxidant-related genes in the hepatopancreas of whiteleg shrimp. Results are presented as mean ± S.E. of 3 replicate tanks. Different superscript letters indicate significant differences (P < 0.05).
3.6. Immune response
In plasma (Figure 4A), groups SO, O2, O3, and O4 had significantly higher THC counts than groups C, S, and O1 (P < 0.05). Groups SO, O2, O3, and O4 had significantly higher ACP activity than groups C, S, and O1 (P < 0.05). Groups SO, O2, O3, and O4 had significantly higher AKP activity than groups C, S, and O1 (P < 0.05). Groups SO, O2, O3, and O4 had significantly higher PO activity than groups C, S, and O1 (P < 0.05). Groups SO, O2, O3, and O4 had significantly higher Hemo activity than groups C, S, and O1 (P < 0.05). Groups SO, O2, O3, and O4 had significantly higher LZM activity than groups C, S, and O1 (P < 0.05).
In the hepatopancreas (Figure 4C), ACP expression in groups SO, O2, O3, and O4 was significantly higher than in groups C, S, and O1 (P < 0.05). AKP expression in groups SO, O2, O3, and O4 was significantly higher than in groups C, S, and O1 (P < 0.05). LZM expression in groups SO, O2, O3, and O4 was significantly higher than in groups C, S, and O1 (P < 0.05). Hemo expression in groups SO, O2, O3, and O4 was significantly higher than in groups C, S, and O1 (P < 0.05). ProPO expression in groups SO, O2, O3, and O4 was significantly higher than in groups C, S, and O1 (P < 0.05).
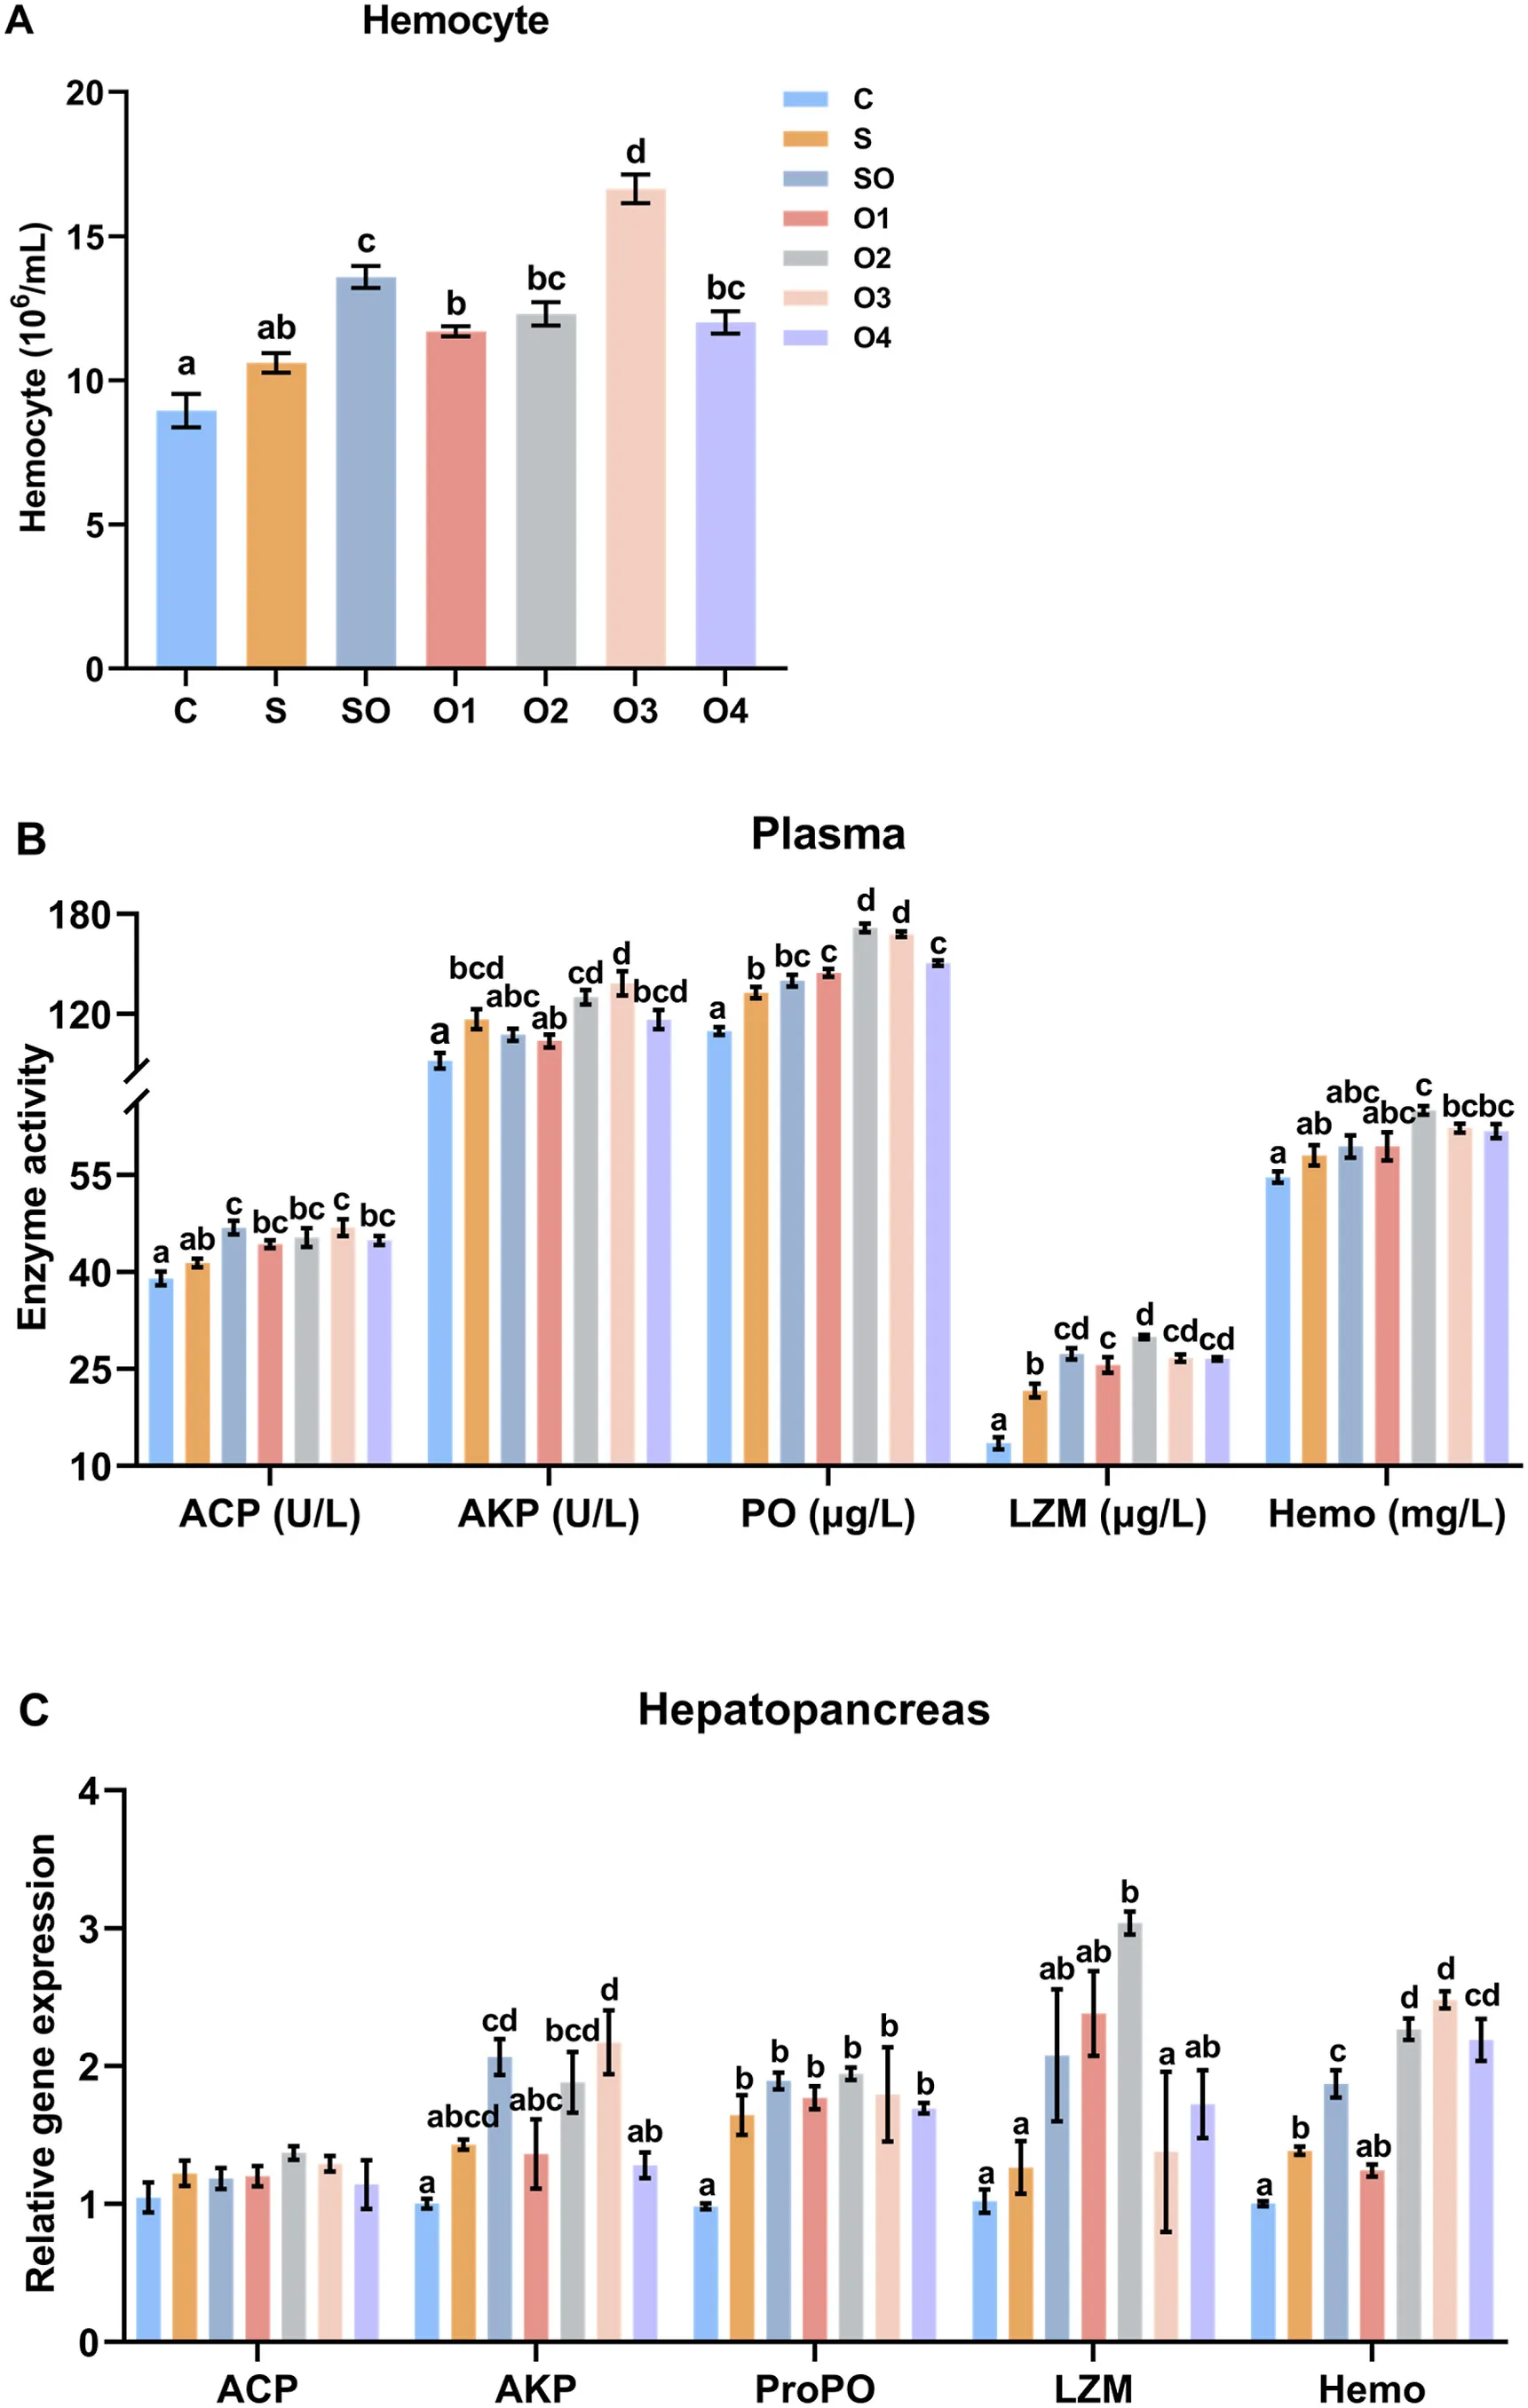
Figure 4. Effects of organic and inorganic copper on the expression of immune-related genes in the hepatopancreas of whiteleg shrimp. Results are presented as mean ± S.E. of 3 replicate tanks. Different superscript letters indicate significant differences (P < 0.05).
4. Discussion
4.1. Growth performance and chemical composition
In this study, no significant differences were found in the growth performance and chemical composition of shrimp among the groups. This result is consistent with previous studies on Russian sturgeon [[21]], Japanese sea bass [[24]], and tilapia [[22]], where no significant differences in growth were observed among different copper sources. However, a previous study on whiteleg shrimp showed that organic copper was 3-4 times more effective than inorganic copper in improving growth [[26]]. This difference may be due to differences in diet formulation. The previous study used a semi-purified diet containing phytic acid, while the current study used a more practical diet. Phytic acid can complex with inorganic copper, reducing its bioavailability [[9],[37]]. Therefore, in diets without phytic acid, the bioavailability of inorganic copper may be improved, leading to no differences in growth among copper sources. Furthermore, shrimp in this study may have received sufficient copper from the basal diet ingredients, so additional copper supplementation did not affect growth.
4.2. Hematological parameters
Hematological parameters reflect the health and nutritional status of animals [[38]]. In this study, organic copper (especially O2 and O3) increased plasma TP, ALB, and Glu concentrations. TP and ALB are important indicators of protein status and liver function [[39]]. Glu is the main energy source for metabolism [[40]]. These results suggest that organic copper can improve protein status and provide energy to shrimp. At the same time, organic copper (especially O3 and O4) reduced plasma TG and T-CHO concentrations. TG and T-CHO are indicators of lipid metabolism [[41]]. These results suggest that organic copper can improve lipid metabolism and reduce the risk of fatty liver.
4.3. Copper accumulation and transport
The results of this study show that organic copper (especially O2 and O3) increased copper concentrations in muscle and plasma. This indicates that organic copper has higher bioavailability than inorganic copper. This result is consistent with previous studies on Russian sturgeon [[21]] and tilapia [[22]], where organic copper increased copper accumulation in tissues.
Furthermore, organic copper (especially SO, O2, O3, and O4) increased the expression of MT and ATP7b like in the hepatopancreas. MT is a metal-binding protein involved in copper homeostasis and detoxification [[42]]. ATP7b is a copper-transporting ATPase involved in copper excretion [[43]]. The upregulation of these genes suggests that organic copper can promote copper absorption, transport, and excretion, thereby maintaining copper homeostasis.
4.4. Low temperature stress
Low temperature is an important environmental stress factor for shrimp [[33]]. In this study, shrimp fed organic copper (especially O2 and O3) had significantly lower mortality rates after low-temperature stress. This suggests that organic copper can enhance the cold tolerance of shrimp. The mechanism may be related to improved antioxidant capacity and immunity, as discussed below.
4.5. Antioxidant capacity
Oxidative stress results from an imbalance between reactive oxygen species (ROS) and antioxidant capacity [[44]]. In this study, organic copper (SO, O2, O3, and O4) increased the activity of T-SOD, Cu/Zn SOD, CAT, Gpx, and T-AOC in plasma and reduced MDA concentration. SOD, CAT, and Gpx are important antioxidant enzymes involved in ROS scavenging [[45]]. T-AOC reflects the total antioxidant capacity [[46]]. MDA is a product of lipid peroxidation and an indicator of oxidative stress [[47]].
Furthermore, organic copper (SO, O2, O3, and O4) increased the expression of SOD, Cu/Zn SOD, CAT, and Gpx in the hepatopancreas. These results suggest that organic copper can enhance antioxidant capacity by upregulating the gene expression and activity of antioxidant enzymes.
4.6. Immune response
The immune system of crustaceans includes cellular immunity and humoral immunity [[48]]. In this study, organic copper (SO, O2, O3, and O4) increased THC counts and the activity of ACP, AKP, PO, Hemo, and LZM in plasma. THC is an indicator of cellular immunity [[49]]. ACP and AKP are hydrolytic enzymes involved in phagocytosis [[50]]. PO is an important enzyme in the prophenoloxidase system, a component of innate immunity [[51]]. Hemo is not only an oxygen-carrying protein but also has phenoloxidase and antibacterial activity [[52]]. LZM is an antibacterial enzyme that degrades bacterial cell walls [[53]].
Furthermore, organic copper (SO, O2, O3, and O4) increased the expression of ACP, AKP, LZM, Hemo, and ProPO in the hepatopancreas. These results suggest that organic copper can enhance both cellular and humoral immunity by upregulating the gene expression and activity of immune molecules.
5. Conclusion
In summary, the results of this study demonstrate that organic copper is more beneficial than inorganic copper for the health of whiteleg shrimp. Organic copper promotes copper accumulation and transport, enhances cold tolerance, improves antioxidant capacity, and immune response. Among the tested organic copper levels, 20 mg/kg (O2) and 30 mg/kg (O3) showed the best efficacy. Therefore, organic copper is recommended for use in whiteleg shrimp feed to improve health and stress resistance.
Author Contributions
Jinzhu Yang: Performed experiments, Data analysis, Wrote original draft.
Zhonghao Zhang: Performed experiments, Data analysis.
Gang Lin: Data analysis.
Mingzhu Li: Data analysis.
Yanjiao Zhang: Designed experiments, Supervision, Writing - Review & Editing.
Kangsen Mai: Designed experiments, Supervision, Writing - Review & Editing.
Declaration of competing interests
The authors declare that they have no financial/personal relationships that could be considered potential competing interests.
Acknowledgments
This research was supported by the National Natural Science Foundation of China (U21A20267) and the National Key Research & Development Program (2022YFD2400304). The authors thank the laboratory collaborators for their support during the experiments.